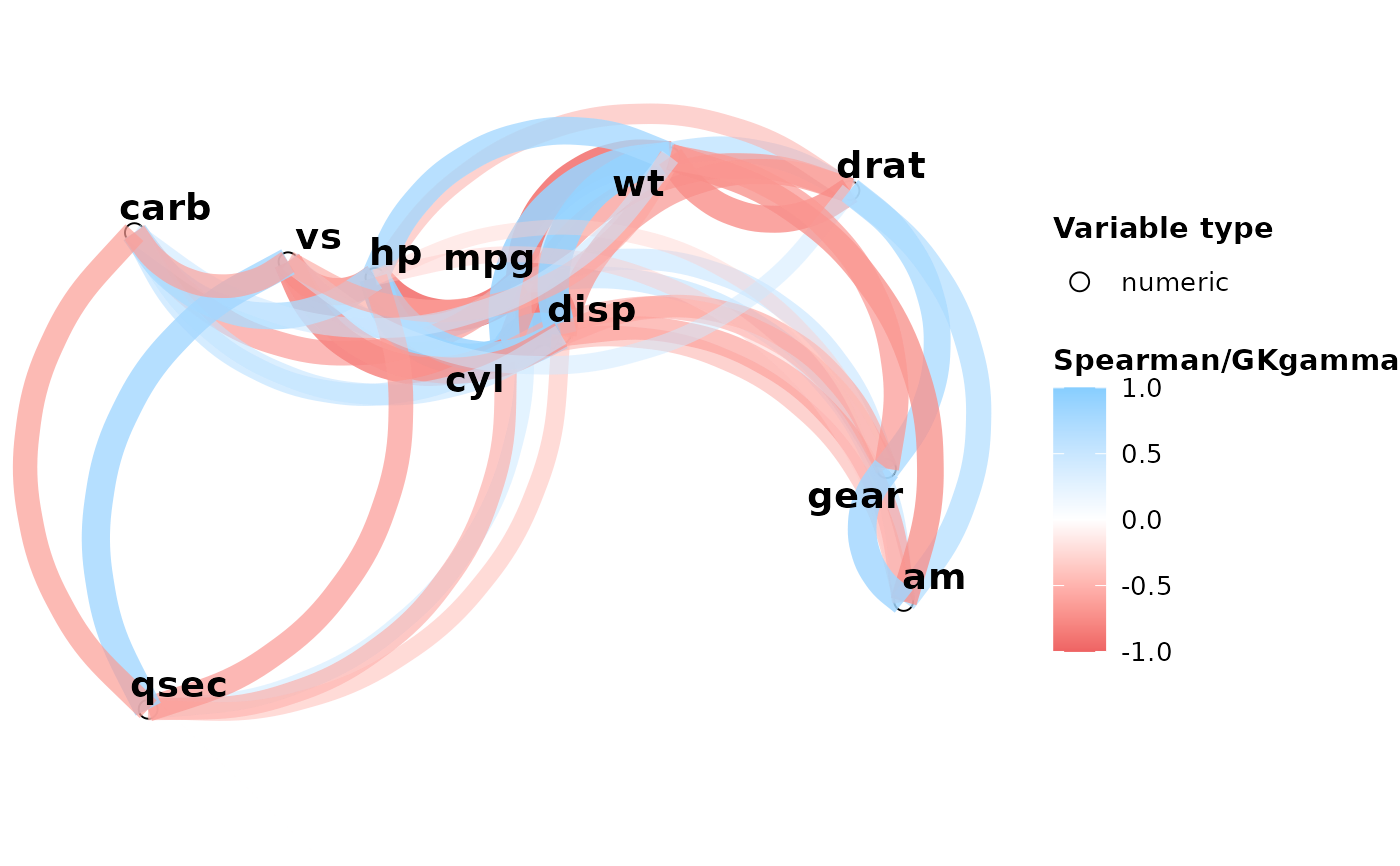
Network Plot of Association
npc_mixed_cor.RdNetwork Plot of Association
Usage
npc_mixed_cor(
  cor_results,
  sig.level = 0.05,
  min_cor = 0.3,
  show_signif = FALSE,
  legend = TRUE,
  repel = TRUE,
  label_size = 5,
  overlay = TRUE
)
Arguments
- cor_results
a visx_cor object or list from pairwise_cor output
- sig.level
maximum significance to be visualized
- min_cor
minimum association to be visualized
- show_signif
whether or not to visualize significance of association
- legend
if TRUE, show legend
- repel
if TRUE, text labels of variable names repel each other
- label_size
size of text labels of variable names
- overlay
if TRUE, only show significant association above min_cor threshold
Examples
data("mtcars")
test_cor1 <- pairwise_cor(mtcars)
npc_mixed_cor(test_cor1)